The Right Sales KPIs For PE Portfolio Company Sales Reps

Measuring sales key performance indicators (KPIs) for your sales reps is critical for sales performance management and building a predictable, repeatable revenue generation process. Studying the “right” sales performance metrics lets sales managers determine which reps are struggling and in which areas they need coaching help with. Unfortunately, a lot of sales managers still struggle with identifying the “right” metrics and typically fall back on traditional basic metrics such as # of activities. Here are 3 key categories of “right” sales performance metrics that you should measure for your sales reps.
(For even more detailed information about measuring sales metrics, check out our FREE eBook: The Right Metrics for Your Inside Sales Team.)
1. Activity Metrics
- # of Activities (e.g. Dials)
- Sales is a function of the number of right activities. This Key Performance Indicator (KPI) answers how many dials your reps made or how many appointments or demos they scheduled.
- Activity Results vs. Activity Goals
- This sales performance metric identifies how your reps are performing in a given period of time compared to their individual activity goals. This is necessary because it helps:
- Identify if reps are moving toward activity goals, measuring their activities juxtaposed with goals.
- Informs whether monthly or yearly goals are too easy or too aggressive. It also compares activities among reps with similar goals to provide healthy competition and motivation. Finally, it allows managers to instantly notice when reps need additional sales coaching to hit goals.
- This sales performance metric identifies how your reps are performing in a given period of time compared to their individual activity goals. This is necessary because it helps:
- Activity Effectiveness (i.e. Activity Ratios)
- Activities to Opps to Deals – Identifies the downstream conversion of the sales rep’s activities to opportunities and ultimately to deals. It’s not just the quantity of your activities but it’s how effective these activities are at getting you Closed-Won Deals. Ultimately, you care about deals or revenue and not mere dials. At many companies, Sales Development Reps (SDRs) are on the Outbound Sales Prospecting Team (aka Sales Lead Generation Team) and are separate from sales closers (aka Inside Sales Reps or ISRs).We frequently find that sales managers at those companies may be misled into believing that, just because SDRs are not responsible for closing sales, they should only be responsible for activities but not for the full cycle all the way downstream to deals. This is a mistake because SDRs can be measured on the “quality” of activities, which is shown in the activity conversion ratios. These are consistent and predictable once you start measuring and noticing patterns from each outbound prospecting rep. Their combined efforts with the closers will be consistent and within a consistent range of conversions from the beginning of making phone dials all the way downstream to a deal.

- Dial:Connect and Connect:Demo rates – The first tells you how well you are connecting to the prospects. The second tells you, once you connect, if you are actually producing early stage opportunities out of these conversations. Even if you are a junior SDR on the Outbound Prospecting team, then you should be measured on whether you are “closing” effectively on these connects to produce a Demo out of your conversations.
- Dial:Deal – Shows whether their Dials are producing Demos which in turn produce Deals. Of course, you should also measure Dial:Demo simultaneously while tracking this Dial:Deal ratio. As a sales manager, you can learn if some particular sales rep or SDR is just aggressive (or maybe too nice and nobody says no to him/her) and is able to get tons of connected prospects to agree to see a Demo all while these prospects are actually not being qualified effectively by this rep and, due to that, there is a high “No Show rate” for this rep’s Demos. The real ultimate result is that this particular rep rarely produces any deals.What we notice is that many sales managers think that measuring Dials all the way downstream to Deals is not a good metric, ostensibly because a lot happens in between that is hypothetically hard to control by the particular SDR. They are misled into believing that the SDR should only be responsible and measured on activities and booking Demos. These sales managers are incorrect – in fact, it’s a great metric to use. The Dial:Deal metric actually locks in the tracking of whether the prospecting SDR is doing a good job qualifying prospects and only scheduling “good” demos that ultimately convert well to Deals. Otherwise you are leaving SDRs to make as many # of dials (# of activities) as necessary to look good on paper and they will push many prospects into Demos which will rarely convert to Deals. This metric is what the best-in-class companies do to measure the effectiveness of their Outbound Prospecting teams.
Learn More About Measuring Sales Metrics »
2. Pipeline Metrics
- Pipeline Today vs. Closed-Won vs. Quota Gap – Informs you what the pipeline looks like today, how many opps each rep has in the pipeline now and what the quota gap is given what’s already closed-won. This metric looks at the current state of your pipeline by close date and identifies the number of opportunities reps have in their pipeline and what stages these opportunities are in. As a sales manager you can use this information to prioritize your team’s efforts. These metrics also get you a high level overview of how many deals each rep has in their pipeline that are set to close in the near term. With it, you can understand who needs to generate more opportunities in their pipeline and who needs to focus on closing their current pipeline. You can also now determine which reps are managing too many opportunities (running too many cycles) compared to their peers and help them focus.
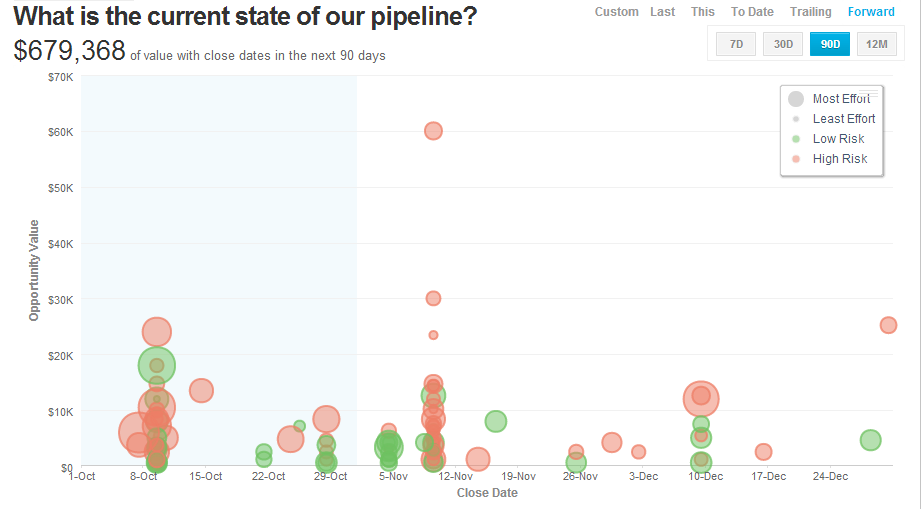
- Historical Pipeline (Pipeline Trending metric) – Informs you of the correct Pipeline to Deal Coverage ratio for your company and your reps, rather than depending on the industry-standard 3x coverage that most companies use (incorrectly). Also allows you to see your pipeline trend – is it going up or down? Despite being a lagging indicator, this sales performance metric tells you where you really stand in terms of your pipeline by looking at a trailing recent period of pipeline increasing or decreasing.
Visualize your sales pipeline with our Free Pipeline Analytics App for Salesforce.com.
3. Retrospective Closed Sales Analysis
- Closed Sales – This is one of those obvious “common sense” metrics that shows how much has already been booked in the current selling period and helps you identify how well this month’s sales are progressing by employee. The key is to look by reps and not in aggregate. You will identify which reps are performing well and which reps are struggling against their own goals. You will also distinguish sales reps who are routinely hitting or surpassing their goals. Finally, you will determine the gap between booked and quota per rep.
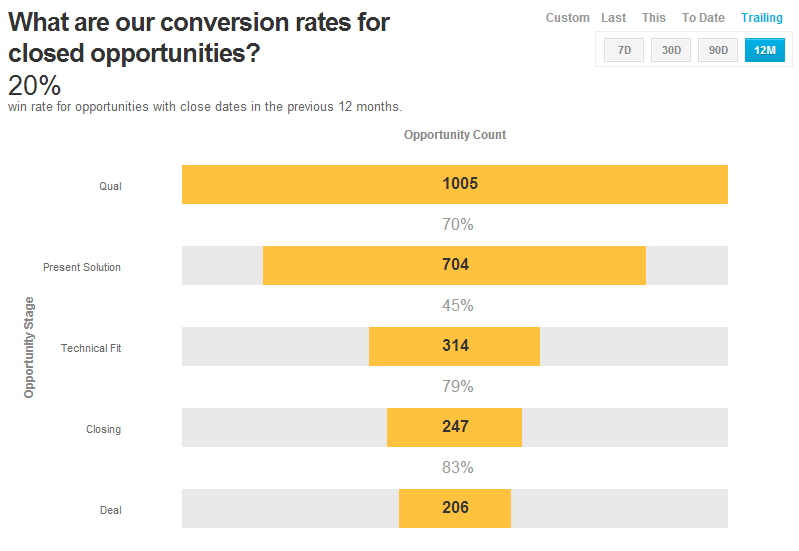
- Sales Funnel (opportunity stages with conversions) – Looking at your sales funnel helps you identify the number and % win rates at each opportunity stage of your sales funnel. You can then find where you can make an incremental improvement in your sales process to have a dramatic impact on your business. Looking at this metric can identify the weakest points in your sales process and display where your reps lost the most opportunities. You will also understand the number of qualified leads your team will need to close opportunities, based on historical % conversion rates.
- Identify the number and win rates at each opportunity stage of your sales funnel.
- Find where you can make an incremental improvement to your sales process to have a dramatic impact on your business.
- Find the weakest points in your sales process and see where your reps lost the most opportunities.
- Understand the number of qualified leads your team will need to close opportunities based on conversion rates.
You should know Sales Funnel conversions for each rep vs. Team Average.
This way, you can gauge if the rep is converting too few deals and where leakages (between which stages) in the process are individually vs. the rest of the sales team.
Download our Free Sales Funnel App for Salesforce.com to visualize your conversion rates by stage.
- $ Cost per Demo – Successful sales managers must calculate the cost per demo (or appointment) and optimize this cost. There are many ways to improve this cost which go back to some of the optimizations that may be done with your sales funnel between stages and also the optimization of activities done in the front end of the process.
- Revenue per Dial – This is both an informative sales performance metric and a motivating point for reps. You can tell them that for every dial they make, they can make X dollars.
- % Won / Lost – Identifies wins vs. losses and the value of those opportunities. See your win/loss trends over time and look at each rep’s performance to see individual win/loss rates. Gauge how your win/loss rate changes as you grow your pipeline. Use dates when your win percentage was at its highest or lowest and set these as a baseline and benchmark for your future performance.
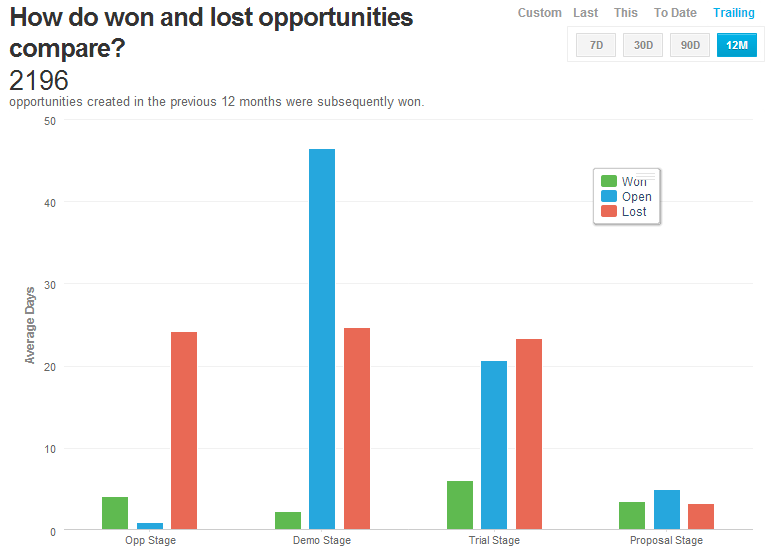
- Sales Win Cycle and Loss Cycle – Look at your Sales Cycle from different perspectives. Your “sales cycle” is the win cycle or low long it takes to go from the time a Lead is converted into an Opportunity to being Closed-Win. Loss Cycle is how long the rep’s lost steals stall in pipeline. Know this by sales rep. Understand which reps are most efficient. Know how long it takes your reps to close business and at what stage struggling reps are getting caught up. Compare reps side-by-side to understand the balance between short-term success and long-term customer retention.
- Sales Cycle by Won/Lost – You should look at win/loss by sales cycle. This identifies sales cycle trends for deals that are won vs. deals that are lost, helping identify the profile of Closed-Won and Closed-Lost opportunities. Understand what a buyer looks like and how quickly they move through the Sales Cycle. Understand what stages you are losing opportunities in and why. Explore the make-up of deals that were left on the table. Recognize the profile of a non-buyer based on Closed-Lost opportunities.